Tuesday, December 3, 2013

Cycles

If we had been waiting for the “year of recovery”, the year local economy was finally going to turn around, 2013 is probably it (and I mean that the way it sounds – yeah, 2013 is probably about the best we can hope for). The year has been bery bery good to commercial real estate, and the wider economy has seen some improvement, though not nearly as much as we would like.

Looking at 2012, we saw a year with faster improvement in the first two-thirds of the year, and then a slow-down and fall that lasted into 2013, essentially erasing all of the year’s earlier gains. When things began turning around in 2013, the question was – will it last?

Now, economies work in cycles (and cycles within cycles, and cycles next two cycles that sometimes correspond, which in itself is another cycle), and cycles don’t necessarily work within the parameters of human defined time. After all, some day had be chosen as the first day of recorded time, and that choice was ultimately arbitrary. If you peruse the accompanying graph, you can see a pretty fair example of these cycles in the CRE Recovery Index (which I’ve now extended back to 1995). From 2002 to 2007, you can see the index peaking in October of each year, and then retreating from November to March or April, before rising yet again.


Even during the crash years from 2008 to 2010 you can see small peaks each October, though obviously during those years growth in the index never lasted for more than two or three months, followed by very sharp declines.

By 2010, the normal cycle had once again reasserted itself. Growth in the index was not as smooth and stable, but did generally follow the pattern outlined above, though with weaker growth and sharper declines than during those halcyon days of old.

What does this mean for 2014? Well, if the pattern holds, it is likely we will see the index begin to retreat in November or December. This retreat will last through the first quarter of 2014. In 2012, the measures that caused the index to tumble were Visitor Volume, New Residents and Los Angeles Port Traffic. In 2011, it was Visitor Volume and Los Angeles Port Traffic. In 2010, it was New Home Sales, Visitor Volume and Los Angeles Port Traffic. Do you see the pattern?

We can assume that Visitor Volume and LA Port Traffic are going to begin to fall in the very near future. At the moment, they remain strong. Their retreat is cyclical, and thus normal and nothing to fear. If they perform better than expected, then so much the better.

The questions we need to grapple with, then, are as follows: 1) Will there be other measures of the local economy that will suffer during the inter-year lag months? 2) Were the growth months in 2013 strong enough to keep us on a better footing after those months of retreat.

My guess is that we will not see any other measures of the economy enter into retreat along with Visitor Volume and Port Traffic, and thus when the Spring thaw reaches us in 2014, we will find ourselves in a stronger position than we had been in 2013, and well on our way towards what we might term a “complete recovery”. I think I see the light at the end of the tunnel.

Wednesday, October 30, 2013

What Exactly Do We Mean By Recovery?

Declaring that an economy has recovered, at least in the context of the latest recession (you might have read about it – it was in all the blogs), is a tricky undertaking. Are we counting “recovery” as a return to the economy at the peak of the bubble, at where it was before the bubble began, or at some guess at where it would have been without the bubble?

Aside from the timing, what are we waiting for to recover? If it was just a matter of visitor volume, Las Vegas finished its recovery last year. Since I'm a commercial real estate researcher working for a commercial real estate firm (Colliers International, to be precise), do I need commercial real estate to fully recover before I declare the local economy recovered?

For the purpose of this article, I offer two definitions of recovery. A recovery will:

• Bring the local economy back to a point before the beginning of the bubble (circa 2005)

• Use an index of the following measures of the local economy – New Home Sales, Commercial Occupancy, Gaming Revenue, Visitor Volume, New Residents, Employment, Taxable Sales, and Port Traffic in Los Angeles (this is the Recovery Index I have been using since 2009)


Using these definitions, Southern Nevada’s economy had an index value of 100 in January 2005. The index reached a peak of 109 in October 2006 and a trough of 83 in April 2010.

At this trough, Southern Nevada's economy reached an index value it hadn't seen since its last recession in 2001/2002 - essentially erasing 8 years of economic growth. It is entirely possible that the growth we might have seen during that period, had there been no economic surge, is gone forever. One could argue that, sans the surge, the economy would have an index value of 110 now, an index value we're about 5 years away from reaching at the current rate of growth, which isn't negligible.

If we look at index growth in 5 year periods, we see the following:

1996-2000 = 26.2% (5.2% average annual growth)
2001-2005 = 19.4% (3.9% average annual growth)
2006-2010 = -17.5% (-3.5% average annual growth)
2011-2013 = 9.4% (3.1% average annual growth)

Current index growth is about 80% of what it was in 2001-2005, and 60% of what it was in 1996-2000. Growth in the last three years is about at 90% of the negative growth experienced in the "plague years" of 2006-2010. If we wanted to erase the effects of the Great Recession, we would need to more than double current rates of growth, a situation unlikely without an explosion in construction activity in Southern Nevada.

Where is Southern Nevada today in terms of getting back to where it was in 2005, what one might call a "do-over recovery"?

In September 2013, Southern Nevada’s economy has an index value of 94, so not recovered yet, but not so far off. In 2012, the index value started at 89, increased to 93 by November 2012, and then it started to fall. From February 2013 to May 2013, the index value stuck at 91. Growth began in June and has continued since. If economic growth in the next few years matches the growth pattern of 2012/2013, Southern Nevada’ s economy should finish recovering by October of 2016!

Could the recovery move more quickly? Naturally. The economy was stronger in 2011 than it was in 2012 and has been in 2013, so it is certainly possible for the economy to recover at a faster pace. If we were to assume economic recovery on pace with 2011, Southern Nevada would have finished its recovery in July 2015 – better, but nothing to crow about.

Given the two possible rates of recovery described above, it seems reasonable to assume that Southern Nevada’s economy, and specifically its commercial real estate market, have at least two or three more years to go before they can be said to have recovered to a pre-recession level. Simply put, Southern Nevada is not currently making up the ground it lost during the Great Recession.

Tuesday, October 1, 2013

Happy Days Are Here Again ... I Hope

The human mind is a funny thing, not only because it apparently has the consistency of chilled pudding, but also because of the way it snaps between despair and ecstasy (though bear in mind that ecstasy is a strong term for what I’m about to discuss).

I was under the impression that net absorption was going to be lower in the third quarter than it turned out to be. It is good news that it wasn't, and though I’ve been a little leery about the industrial market due to weak job numbers and the large impact of build-to-suit projects on that net absorption, I’m almost ready to declare the industrial market completely healed, throw the confetti, toot the horn and start being an optimist.

When a person is expecting bad news, good news has a greater impact on their mood than it would have had had they been expecting good news. The reverse is true as well. It’s important for us to check our optimism and pessimism at the door when prognosticating, and instead look at the data and the trends it suggests, draw on our experience with past trends, and come to a reasonable conclusion.

A full year before the beginning of the Great Recession, I noticed that industrial vacancy rates were on the rise. Gross absorption was slipping a bit, but we were adding tons of new space that was not pre-leasing well. While the trends suggested to me that demand was flagging, the market had conditioned itself to expect strong demand, and proceeded on that assumption. Why let the facts get in the way of a good story, after all. That being said, I certainly did not expect demand to suddenly fall off a cliff at the end of 2007.

Now we’ve been engaged in the Great Recession for nearly six years. Gross absorption is healthy but not really on the increase, but net absorption is very strong, suggesting that existing tenants are no longer downsizing or closing their doors. The lack of new industrial jobs would tend to corroborate this impression on the market, as a lack of closures and downsizing does not necessarily translate into job growth. This is good news, and yet I’m having a hard time expecting it to continue.

So, what’s the story in Southern Nevada’s commercial real estate markets? As much as I fear admitting it, I think Southern Nevada has finally entered the recovery phase (I’m crossing my fingers right now hoping that the fourth quarter doesn’t make me look like an idiot). While job growth is not terribly strong (though this might have something to do with how the data is collected), most economic measures are leveling off or improving, and the real estate numbers have been pretty strong across the board.

The industrial market looks poised to absorb more space in 2013 than it absorbed through the entire Great Recession, and if net absorption remains somewhat constant, the industrial market will be ready for new speculative construction in about 12 months. Retail has been in positive net absorption territory for about two years, and though office is still seeing declining asking rents, its net absorption has been pretty strong for the past year-and-a-half. Office is not doing well in 2013, but that has something to do with continued weakness in the financial services sector (including real estate) and the health sector (health services companies tend to take space in professional office space more than medical office space these days, much to the regret of medical office landlords).

Office notwithstanding, the Great Recession appears to be over. Go ahead and throw some confetti - get it out of your system - and brace yourself for 2014.

Monday, September 23, 2013

Any Diversification Today?

In today’s post, I want to examine how the landscape of commercial real estate had changed over the past three years in terms of tenant industry (i.e. what line of business the tenants were in). This is new ground for me, so I decided to begin with the industrial market, examining what share of industrial lease and user sale activity different industries held.


If you think this graph did not help increase my understanding of the situation, you are correct. Different industries have, on a quarter by quarter basis, had their ups and downs, but the only industries to show a trend were manufacturing and construction, and those trends were pretty slight.

To get a better handle on the situation, and gain some context, I decided to abandon my relatively small sampling of lease and sales activity data for a much broader store of data – employment.


When we look at jobs in Southern Nevada, we see surprisingly little change over the past twenty years in the share of jobs between different sectors. The only significant changes have been in the construction sector and leisure and hospitality sector.

The construction sector held 9 percent of the region’s jobs in 1994, swelled to a colossal 12 percent in 2005/2006, and has now fallen to just 6 percent of the region’s jobs. While a farmer with nine cows and one pig could create the illusion of farmyard diversification by killing eight of his cows, he certainly would not be better off than when he started. Having 2,000 fewer construction jobs now than in 1994 has not improved economic diversification in Southern Nevada.

The leisure and hospitality sector, on the other hand, has added almost 107,000 jobs over the past 20 years, but has seen its share of the job market shrink from 35 percent to 32 percent. Perhaps this is not a massive drop, but one that is indicative of some diversification of employment. Over the same period, the share of employment in the professional and business services sector and the education and health sector have both increased by 3 percentage points. Again, this may largely be a matter of the draw-down in construction jobs, but both sectors have shown percentage growth in excess of 140 percent over the past twenty years, adding a combined total of 113,900 jobs. It seems likely that the leisure and hospitality sector has lost some of its employment share to these two service industries.

This may not be the diversification some folks want, but it’s the diversification we have for now.

Wednesday, July 24, 2013

Once Bitten, Twice Shy

After surviving an impressive housing bubble that burst just 5 years ago, many Las Vegans are eying the current housing recovery with a suspicion. The sales figures look good, but with prices increasing by 20% or more year-to-date, are we just entering a new housing bubble?

First, let’s examine the market of yesterday and the market of today. In the period 2005 to 2007, Las Vegas saw an average of 2,625 new homes sell per month, while the median price of a new home increased 5.8 percent over that period. In the past twelve months, new home sales have averaged 573 per month, and the median price of a new home as increased by 11.5 percent. So, obviously, even if a bubble is forming now, there is a magnitude of difference in scale between what was occurring then and what is occurring now.

The activity of investors is often pointed to as another similarity between then and now, but this is not quite so. The investors that caused heartache a few years ago were often over-leveraging themselves to buy homes that they thought they could re-sell at a tidy profit in just a few months. Unfortunately, they discovered that the amazing price increases they were seeing were all due to the activity of other investors, and even with very low interest rates and the willingness of traditional home buyers (or lack of knowledge) to borrow far more than they could afford, the investors priced the occupiers of homes out of the market, found they could not keep up their mortgage payments, and the market collapsed. Home builders, working feverishly to keep up with the perceived demand, built many more houses than were needed, and thus the housing crisis and the Great Recession.

How are things different today? The investors of today are not the investors of yesterday. Having spoken to people within the housing industry in Southern Nevada, I have found that the individual investors of today are coming in with plenty of cash and are not over-leveraging themselves to buy investment homes. Moreover, many of the investment sales we are seeing in Southern Nevada today are by institutional investors, buying hundreds of units, often directly from banks.

How are things the same? When housing sales are driven by investors, they leave a gap in the market. From the perspective of home builders, a house sold is a house that is off the market. In fact, though, an empty house is still effectively on the market. When tracking commercial real estate, vacancy is the thing that matters! An investment property must eventually pay for itself, either by means of rent paid by an occupant, or by the value of the property appreciating past the value of the loan taken out to buy the property in the first place. The last bubble was driven by such appreciation of value, not by renters occupying houses, but the appreciation could not keep pace with the prices being paid for houses.

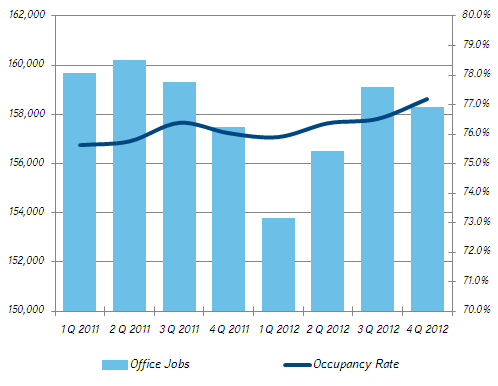
More importantly, when home builders saw houses selling a few years back, they took it as a sign that more houses were needed. Home builders today are gearing up to begin building houses in earnest once again in 2014. The question is whether they are building for investors or for occupants? Unfortunately, the vacancy rate for single-family homes is notoriously hard to determine, with different groups (the U.S. Census Bureau being one) coming up with wildly different numbers. This is unfortunate, because it would fill a crucial gap in our knowledge of the home market.

One clue to whether Southern Nevada is once again getting ahead of itself might be found by comparing household growth in Clark County (based on information from the Clark County Demographer and Claritas) to new home sales (based on information from Dennis Smith’s Home Builders Research). Demographic data from Claritas states that 42.9 percent of households in Clark County rent homes or apartments rather than own single family homes or condos, so we’ll adjust the household growth figures by 43 percent to get a better idea of how many buyers were entering Clark County each year.


What does this graph tell us? First and foremost, in-migration into Southern Nevada dropped sharply in 2008, 2009 and 2011, but has generally been on the rebound in the past two years. Second, we see that new home sales decreased substantially in 2007, at the beginning of the housing crisis, and continued to plummet in 2008 and 2009; in 2012 they began a slow recovery.

In 2005 and 2006, Southern Nevada was selling approximately three times as many new homes as it was adding new households that were likely to own homes. This suggests that most of these new homes were purchased by investors rather than occupants. The percentage declined in 2007, reaching what would be the lowest percentage in the nine years covered by this chart. In 2008, the first full year of the Great Recession, almost five times as many new homes were sold as new households moved into Southern Nevada, despite a steep decrease in the number of new homes sold. Since 2009, Southern Nevada has gained an average of 1,300 households per year and sold an average of 5,400 new homes per year, again, more than 4 times as many new home sales as new households likely to own rather than rent entering the region.

In 2013, Clark County is projected to expand by 3,200 households and sales, if they remain steady, should reach 7,200 new homes, approximately a 2:1 ratio. While this is not as high a ratio of new home sales to new households as recorded in 2005, 2006 and 2008, it is higher than in 2007 (when the market began to cool), 2010 (when the federal government juiced the housing market) and 2012. This suggests that investors once again are beginning to dominate the housing market. Fortunately, they are buying new homes at lower prices (28 percent lower) than they were in 2005, but the median price of a new home has increased by 13 percent in the past five months. While this is good for house flippers (though we know how that story ends), it is bad for owner/users and problematic for landlords, as they must still compete with multi-family projects and cheaper, existing homes that are on the rental market.

If Southern Nevada’s population was expanding more rapidly, and if the median new home price was expanding much more slowly, I would feel more comfortable about the current expansion in new home sales. As it stands, home builders must be very careful about new home construction in 2014, as they might once again find themselves building more homes than they can sell if investors once again cool on Southern Nevada.


Tuesday, June 11, 2013

Vegas Enjoys the Spring Thaw

Waaaay back in November of 2012, the Las Vegas economy, which had been in growth mode for a good 10 months, decided to take time off for the holidays. What followed, in terms of the CRE Recovery Index I maintain, was a pretty rapid slide, from an index value of 91 (a value of 100 represents the economy as it was in January 2006 – i.e. the “good old days”) down to 86, roughly the value we had in December 2011 just before the 2012 growth spurt began.


In March, though, the index began to grow again, and in April 2013 it stands at an 89, not far from the 2012 high and well above the low of 80 recorded in March 2010 at the low-point of the recession.

On a year-over-year basis, the following components of the CRE Recovery Index have posted growth, going from the highest growth to the lowest: New Home Sales (76.6 percent growth), Clark County Taxable Sales (5 percent growth), Gaming Revenue (3.1 percent growth), Employment (2.2 percent growth) and Commercial Occupancy (1.8 percent growth). With the exception of new home sales, we’re looking at very moderate growth in the economy. Depending on who you speak to, new home sales are either going to maintain their dynamic growth, or they’re at the end of it, but for now they are definitely driving the CRE Recovery Index higher. If new home sales do slack off in the coming months, it is likely the index will either turn flat or begin to decline once again.

Components of the index that experienced negative growth over the past 12 months were New Residents (negative 12.6 percent growth), Container Traffic in Los Angeles (negative 7.1 percent growth) and Visitor Volume (negative 0.6 percent growth). While a small dip in visitor volume isn’t much to worry about, the much larger dip in residents moving to Clark County is, as a lack of new bodies could disrupt new home sales.

Wednesday, April 24, 2013

Get It Together, Vegas

Have you ever known somebody who just couldn’t get it together, at least not permanently? They would get their stuff together for a few months, and then slide right back into their old back habits. If you work in Las Vegas commercial real estate, the answer is yes, and the friend is the real estate market.

2012 was a pretty good year for our CRE Recovery Index. There were a couple small dips in the index, but overall, things were looking up. The market did pretty well, as the index is supposed to predict, with office and retail putting up good, though not great, numbers, and industrial lagging behind until the first quarter of 2013, when it showed some surprising life. 2011 was a year of peaks and troughs, with things better at the end than the beginning, but 2012 was a pretty smooth ride in the right direction. And then 2013 showed up.


Just as the market posted its first all-around positive quarter in 5 years, with the industrial, office and retail markets all showing positive net absorption, the index was heading down. December 2012 saw the index fall from 91 to 88, inspired by lower visitor volume and gaming revenue and a less traffic through the port of Los Angeles. This wasn’t too worrisome, though, since tourism numbers can fluctuate and port traffic is, at best, a minor piece of the puzzle for Southern Nevada. January remained at 88; port traffic dropped again, but so did the number of new residents moving into the Valley, new home sales and, once again, visitor volume. These were balanced, though, by higher gaming revenue and taxable sales. February saw another dip in the index, down to 86, where the index stood in January 2012. New home sales were down again, as was gaming revenue, visitor volume, new residents and taxable sales. Is it time to worry?

If the index is accurate, it predicts a slow second quarter for commercial real estate, and perhaps a slow third quarter as well. That doesn’t necessarily means negative net absorption, but just less positive net absorption than we would like. While the office market has had three quarters of positive net absorption, the numbers have been on the decline. Retail has also been positive but weak. Industrial has the benefit of strong build-to-suit activity now, and will probably do well through mid-year. But, in general, the way ahead for commercial real estate could be a little rocky for the next few months.


Monday, April 8, 2013

The Future of Vacancy in Las Vegas

Image by Lasvegaslover, from Wikipedia article
Imagine if you will a car accident on a busy street. The accident is a big one, and it is clear that the street will be blocked for some time. Naturally, drivers on their own would begin searching for alternate routes. Before too long, the side streets would be filled with cars avoiding the accident scene, and though things would be slowed down for a while, eventually they would be back up to speed (or close to it). In time, the accident would be cleared, and life would go on just as it had before.

Imagine, however, if the accident could never be cleared. Cars would simply take to those side streets as the “new normal” and the old street would fall into disuse. What I’m getting at here is the concept of being left behind.

Commercial real estate in Southern Nevada may be going through a similar situation. When the market was overbuilt in the mid-2000’s, vacancy rates skyrocketed. Now, having trudged through 5+ years of recession, the market appears to be returning to some level of normal demand for product. The assumption by some, of course, is that vacancy will now return to where it was before the recession – perhaps slowly, but inevitably.

The truth, however, is that it might not. Buildings that were completed during the boom may, in fact, never be filled with tenants. Location and designs are two reasons, of course, for why these buildings may remain unpopular with potential tenants, but age is now becoming a third. Some of these unlucky buildings are not 5 to 6 years old. Potential tenants of these buildings may begin opting for newer buildings – build-to-suits, of course, but also the new speculative product that is bound to be built over the next 5 years. What happens to these “lost buildings”?

On the one hand, they may find favor with tenants looking for second generation space; in essence, they can fill a temporary niche of virgin second-generation product – old enough to be had at a discount, but not carrying the baggage of former tenants and tenant improvements.

On the other, they may find themselves candidates, in due time, for redevelopment. The market, finding it has no use for so much single-tenant office or light industrial, decides it needs land for the developments that it does need in the future. If the latter is only partially true, we can expect to see a new floor on just how low vacancy rates can go for commercial product. Ultimately, though, we need to investigate whether theory is reality.

During the boom, we discovered vacancy “floors” of approximately 4 percent for industrial product, 8 percent for office and 3 to 3.5 percent for retail. The industrial market now has approximately 3,000,000 square feet of space that has been vacant for 4 to 6 years, corresponding roughly with the final phase of the construction boom and the initial phase of the Great Recession. If we were to assume that this space was so undesirable that it would never be occupied, it would represent about 3 percent of the total industrial inventory, and would thus push that vacancy “floor” from 4 percent to 7 percent.

For office product, about 2.5 million square feet, or approximately 6 percent of office inventory, has been vacant for 4 to 6 years, potentially increasing office’s vacancy floor from 8 to 14 percent. Clearly, office product has a more serious problem than industrial. For retail, the figure is 3 percent, potentially increasing the retail vacancy floor from 3 to 6 percent.

A full break-down of vacant commercial space based on its time-on-market follows:


While this investigation is not as thorough as it would need to be to classify it as fact, it is suggestive that even with normal demand for product Southern Nevada’s commercial market is likely to see elevated vacancy rates for the foreseeable future.

Wednesday, March 6, 2013

Three Recoveries

Are we in recovery? That’s the question I keep hearing, but there’s a flaw in the premise. When the house of cards fell in 2007, Southern Nevada was hurt in three distinct segments of its economy, and while they are to some degree connected, each is going through its own recovery cycle.

So, when we wonder about the pace of recovery, we need to think about three different recoveries: The gaming/hospitality recovery, the residential real estate recovery and the commercial real estate recovery.

Before we examine those recoveries, though, we need to also examine the concept of “recovery”. When a minor recession hits, it is followed, eventually, by a minor recovery. A minor recovery leaves an economy looking much as it did before the recession. Think of it as recovering from the flu – you aren’t fundamentally changed by the illness when it’s finally over.

An economy that suffers a major recession, however, is often changed in important ways when that recession transitions into recovery. This makes major recoveries a tricky thing to track, as we’re waiting for the facts and figures to “return to normal”. Unfortunately, there is a new normal, and we might not realize we’ve reached it right away, since it’s unlike anything we’ve ever tracked before. Southern Nevada is now recovering from a major recession, so expect change.

Now, we examine the three recoveries of Southern Nevada. First and foremost is the big dog in Southern Nevada – gaming and hospitality. At its depths, visitor volume was 7.8 percent below its height in 2007, while gaming revenue suffered a 23 percent decline. From these figures, we can say that visitor volume went through a minor recession, while gaming revenue suffered a major recession. By the end of 2012, visitor volume was 1.3 percent higher than in 2007, while gaming revenue was still 15.6 percent down.

I think it’s safe to say that visitor volume is recovering, but gaming (can’t we just call it gambling?) revenue, which has shown growth, remains weaker than we would expect given the visitor volume. This is one of those transitions we need to look out for. New Vegas visitors are spending less money, overall, but are also shifting their spending towards food and entertainment (sure things, one might call them) from gaming. Just the same, with growing taxable sales and visitor volume, it’s a pretty safe bet that the “engine of our economy” is recovering.

Residential construction is the segment that put the “major” in our “major recession”. There are now fewer construction workers employed in Southern Nevada than 20 years ago – pretty much says it all. Fortunately, we are seeing some recovery in this segment, with inventories of new and used housing falling and many developers looking forward to starting new developments in the next couple years. Southern Nevada’s population is again on the rise, after a first in 30+ years dip in 2008. There have also been reports of median home prices rising in Southern Nevada. So – housing is in a slow recovery in Southern Nevada, but definitely heading to a new normal. Demographics are changing – extended families, more apartments for young folks who are burdened with paying for their elder’s retirement (I love hearing about those hover chairs that don’t cost the elderly ONE CENT).

Commercial real estate may not be the third pillar of the local economy, but it is related to residential real estate and it’s obviously important to this office. I can happily say that commercial real estate is recovering, slowly perhaps, but is also heading towards a new normal. Expect much higher than usual vacancy rates for the next decade, as thousands of square feet of old space are ignored and new projects are started. Commercial real estate is still a mess, but it’s getting better!

So, three recoveries are needed, and three recoveries are happening. What we're in the process of discovering is how quickly these recoveries are happening, and what we're recovering to.

Thursday, February 21, 2013

What Lies Ahead for Medical Office?

After a strong third quarter, medical office fell back into negative net absorption in the fourth quarter of 2012. For the year as a whole, medical office returned 61,723 square feet to the market, net, despite a steady increase in health care oriented employment. Why such a discrepancy between jobs and net absorption? Health care in the United States, and the medical practitioners who deliver it and occupy medical office space, are going through a transition period. Not only are the days of private practice falling to the rise of medical groups, who require less space to do the same work, but the need for efficiency and lower prices are shifting medical resources from the traditional medical office buildings (MOB’s) of the past to new concepts that often take space in retail centers to be closer to their patients. The times are changing for medical office.


The rise of medical groups, such as Accountable Care Organizations (ACO’s), and alternative vectors of providing healthcare are putting the squeeze on medical office right now. Doctors, insurers and patients are all going through a slow discovery process of just what the Affordable Care Act means to them, and doctors and insurers are especially trying to come to grips with what these government-mandated changes will mean to their business models. Owners of medical space also need to come to grips with the changes that are on the horizon for medical care. With group practices and urgent care facilities set to dominate healthcare delivery in the future, medical office buildings will need to be retro-fitted to accommodate these tenants, and that requires a capital investment. With margins likely tightening, passing these tenant improvements on to the tenants will be tricky.


The uneven application of “Obamacare”, compounded by balking among members of the president’s own party regarding associated taxes, should insure a bumpy road for medical office over at least the next four years. More importantly, while the government-medical complex is working out the kinks, private enterprise will continue to innovate in the health care arena. From Wal-Mart’s foray into small pharmacies on medical campuses to health care in Targets, more and more medical office dollars are going to flow into non-medical real estate, putting the crunch on landlords already dealing with consolidations and downsizing among physicians. We think we will continue to see the medical office market bounce along the bottom in 2013 while medical office users survey the new medical landscape and prepare for the future.


Thursday, February 14, 2013

2013 - Are You a Good Year, or a Bad Year?

As we bid a fond farewell (or good riddance) to 2012 and usher in brand spankin' new 2013, it is natural to wonder just what we're getting ourselves into.

After all, 2011 was a pretty decent year for Las Vegas CRE, so it was a bit of a shock when 2012 hit us like a ton of bricks. Fortunately, 2012 got a bit sunnier at the end of the year, but will the trend continue? Will 2013 be a good year for Las Vegas CRE, or another washout year like 2012? Well, let's look at the index ...


The CRE Recovery Index was on its way up through most of 2012, predicting that positive movement towards the end of the year. But in September, the index began to go flat, and in November and December it began to fall. In and of itself, this is not odd – it usually does begin to fall towards the end of the year, and on the positive side, the decline in 2012 was not as severe as in the past two years. In general, the rise of the index in 2012 was more stable than in 2011, and there is every reason to believe that this slow and steady rise will be seen again when January and February numbers become available to us.


On a year-over-year basis, the December 2012 New Home Sales index and Taxable Sales were up sharply, and increases were also seen in the Commercial Occupancy index (finally), Visitor Volume and Employment. Port traffic in Los Angeles was down considerably on a year-over-year basis – a minor factor in the overall CRE Recovery Index – and Gaming Revenue was down as well.

In general, the cycle appears to be operating as usual. Growth was slower and steadier in 2012 than in 2011, and at the moment we can probably expect 2013 to look similar. Higher taxes and increased costs for healthcare and health insurance, along with the currency wars that are being fought between the industrialized debtor nations of the world, might hamper that growth, though, so keep your head on a swivel.

Tuesday, February 12, 2013

Office Gets Into Gear

Last quarter, we said that Southern Nevada’s office market was in neutral. This quarter, it may have finally gotten into gear. For the third straight quarter, Southern Nevada’s office market posted positive net absorption and office vacancy decreased. Vacancy stood at 22.8 percent in the fourth quarter of 2012, feeding off of 265,336 square feet of net absorption. There were no new completions this quarter, and the weighted average asking rental rate fell to $1.88 per square foot (psf) on a Full Service Gross (FSG) basis. Given the office market’s recent history, one feels hesitant to let their joy be unrestrained, but it looks as though the office market might finally be in recovery mode.


According to the Nevada Department of Employment, Training & Rehabilitation, between November 2011 and November 2012, a net of 500 office sector jobs were gained in Southern Nevada. The professional & business services sector, which had been adding jobs in 2011, has dropped 400 jobs over the past twelve months. The financial activities sector, which includes insurance and real estate, continued its decline as well (though at a slower pace), losing 200 jobs over the past twelve months. The health care & social assistance sector added 1,100 jobs over the same period, though this sector has a limited impact on the professional office market. Unemployment in the Las Vegas-Paradise MSA stood at 10.4 percent as of November 2012, down from 13.0 percent in November 2011. Over the same period, total employment in Southern Nevada has increased by 6,300 jobs, the majority in the education and health services sector and the trade, transportation and utilities sector. The leisure and hospitality sector had been growing at a strong pace through much of 2012, but slowed in the latter half of the year.


If Southern Nevada’s office market is still bouncing along the bottom, then the fourth quarter of 2012 found it on the upward leg of its trajectory (and hopefully not its apogee). After five years of ill news, it would be our fondest desire to declare three quarters of positive (if somewhat weak) net absorption and falling vacancy rates a trend and predict a stellar 2013 for the office market. Two things (only two?) keep us from taking this plunge. The first is the uneven growth in office jobs, the foundation of demand for office space. If office jobs gains were clearly on the rise, it would be sensible to predict a strong 2013 for office demand. National and global headwinds, from the dreaded “fiscal cliff” to the slow-down (or potential slow-down) in Europe, China and Japan also keep the prognosis for Southern Nevada’s own economy in 2013 a bit hazy. By and large, the local economy should see continued slow growth in 2013, and we believe the office market will follow suit. If the economy does turn sour, though, expect continued difficulties for the office market as well.


Tuesday, February 5, 2013

A Good Year for Retail, But What Lies Ahead?

The fourth quarter of 2012 saw another quarter of positive performance for Southern Nevada’s retail market, the sixth quarter in a row and a sure sign that Las Vegas has some life left in it yet. While overall activity did not rise, it appears that fewer retailers are now downsizing or closing up shop, and that helped produce 117,731 square feet of positive net absorption. The vacancy rate has now decreased by 1.4 points over the past four quarters, reaching 10 percent in the fourth quarter of 2012. Asking rents have continued to slide, and there were no new completions of anchored retail this quarter.


Southern Nevada currently has 1.16 million square feet of big-box space available in the marketplace, representing a vacancy rate of 6.1 percent and at an average asking price of $0.94 psf NNN. Shop-space had a vacancy rate of 14.1 percent and asking rate of $1.41 psf NNN. While shop-space has a higher vacancy rate than big-box, the big-box’s hold about 24.6 percent of all the vacant retail space in Southern Nevada’s anchored centers. Net absorption (including vacant sublease space) in big-box space over the past quarter was 18,133 square feet. Shop space posted 291,470 square feet of net absorption over the same period. Filling big-box space could be a slow process, especially given the current trend in big-box retailing to downsize their stores in the face of “showrooming” by customers who browse in brick-and-mortal retail stores, but finalize their purchase online.


There is no denying that the retail market just finished up a productive 2012. Net absorption was positive for the year, gross absorption was up and overall vacancy is falling. Asking rents have not yet started to recover, but if demand for retail remains strong in 2013 that might change. Despite all of this positive news, there are concerns to be had about the future. Retail in Southern Nevada is overbuilt, and internet retail has the potential to put a damper on future demand for retail space even as consumer spending recovers. Much of the retail space that is now vacant was constructed at a time when making a project look good on paper trumped design considerations and, in some cases, common sense. As a result, much of the overhang of retail product will have a hard time ever attracting tenants, leaving Southern Nevada with two retail markets, one of well-located, well-designed centers commanding strong rents and boasting high occupancy, and another market of retail projects that languish on the margins. Despite these misgivings for the future, we still believe that the overall trajectory of the local retail market is positive, and will remain so in 2013 and beyond. The recovery we have been waiting for is finally here, and while it might not be stellar, it is real and appears to have legs.


Friday, February 1, 2013

Industrial Looks to 2013 (‘Cause 2012 Is Better Forgotten)

Excerpts from the Colliers International Q4 Las Vegas Industrial Report ...

While the office and retail markets in Southern Nevada continue to improve, the industrial market appears to be the wallflower of commercial real estate. The culprit is most likely the construction sector, for other sectors of industrial employment are showing year-over-year job gains. After a positive year of net absorption in 2011, the industrial market gave back 268,000 square feet of occupied space in 2012. The vacancy rate increased to a new high of 15 percent, and asking rental rates dropped, year-over-year, by $0.03, to $0.48 per square foot (psf) on a triple-net (NNN) basis. For the industrial market, recovery remains elusive.


By any measure, 2012 was a disappointment, though not necessarily a surprising disappointment. The surge in industrial activity experienced in the middle of 2011 raised hopes, but the slow down experienced in late 2011 tempered expectations for the new year, and most people understood that there were head winds to overcome. Industrial employment growth was weak in 2012, and demand for industrial space generally followed suit. As people once again begin moving into Southern Nevada and the available housing inventory is slowly drawn down, the construction sector should find its bottom and then begin to grow. This could still be a two to three year process, but unraveling the problems created during the housing bubble is a tricky thing that cannot be rushed. Several build-to-suit industrial projects are slated to be completed in 2013, and this should help improve the numbers, at least temporarily, but it seems increasingly unlikely that Southern Nevada’s industrial market will really recover until the construction sector finally stabilizes and then begins to grow again. We think 2013 holds the possibility of slow growth, but it is more likely that 2013 will be another difficult year for the industrial market, with as many negatives as positives.

Click here for the full report

Wednesday, January 16, 2013

Gazing in the Crystal Ball for 2013

I'm going to start posting some excerpts from the Q4-2012 reports on this blog, but first decided I'd do a little forecasting with the CRE Recovery Index.

In general, 2012 had a decent close for office and retail, though industrial (and specifically warehouse/distribution) continued to show weakness, and in fact took a step back in 2012. While predictions for economic growth (national) in 2013 vary widely, few economists seem to think 2013 is going to be especially strong - perhaps better than 2012, but not stellar.

The CRE Recovery Index would seem to support that supposition for early 2013, as it hit a three month plateau and then dropped slightly in November. In all, 2012 showed steadier growth than 2011, which was a real roller coaster. A depressed index in late 2012 points to a depressed first half (or at least first quarter) in commercial real estate.

In November, the index components worked out as follows:

New Home Sales: +7 Y-O-Y - new home sales are showing a definite improvement in Southern Nevada, hitting a level we haven't seen since early 2009. They still have a really long way to go, but any positive movement here is welcome.

Commercial Occupancy: +1 Y-O-Y - it took a long time to get this index to move, but strong net absorption numbers in the retail and office markets finally got commercial occupancy to increase by a click in August 2012. These numbers are quarterly, and the fourth quarter saw no movement over the third quarter.

Visitor Volume: +0 Y-O-Y - visitor volume in Southern Nevada, despite being flat in November on a year-over-year basis, was in record territory in 2012.

Gaming Revenue: +1 Y-O-Y - in general, gaming revenue has not been as strong as visitor volume - more people, but less gambling - but it is showing recovery from the depths of the recession.

New Residents: +6 Y-O-Y - this is probably the more important index to watch. Many would hold that construction was the second pillar of Southern Nevada's economy, but they're only partially correct. Migration was the second pillar of our economy, with construction being a very visible component of migration into the Valley. People are once again coming to our balmy shores (okay, we don't have shores, but you know what I mean), and that should go a long way to helping the local economy to recover.

Employment: +1 Y-O-Y - employment has been only marginally better in 2012 than 2011 and 2010. The hospitality sector posted strong job gains in the early part of 2012, but has now settled back down. Government is hiring again (take that whichever way you want), as is the health services sector (though it isn't translating into increased demand for medical office space), while construction and financial services are still the big losers. In terms of local CRE health, new residents is phase one, new jobs is phase two. We're seeing movement in phase one, so we will hopefully see phase two light up in 2013.

Taxable Sales: +5 Y-O-Y - taxable sales is the other big mover for Southern Nevada in 2012. The taxable sales index went from an average of 79 in 2010, to an average of 83 in 2011 to 2012's average of 88. Definite progress, and probably why the retail sector is showing signs of being the first sector to post real, solid recovery in the market.

Port Traffic: -6 Y-O-Y - port traffic in Los Angeles is a minor part of the index, and overall is stronger than it was before the recession.

All in all, look for a slow start to 2013, with retail probably showing the most resilience. The office market did well in late 2012, but employment growth in office sectors is marginal and I frankly don't trust it. Outside of warehouse/distribution, industrial is doing well - it will unfortunately probably do more of the same in early 2013.
Related Posts Plugin for WordPress, Blogger...