Monday, May 7, 2012

Don't Page the Fat Lady Just Yet

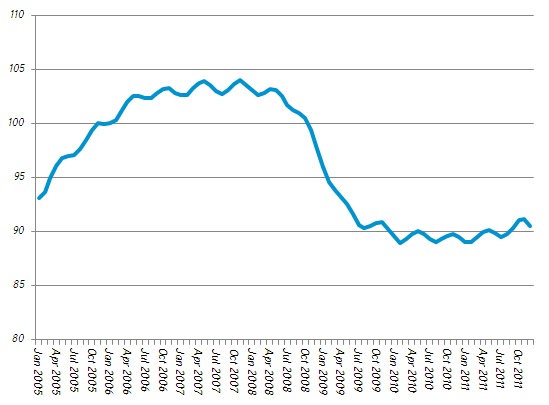
The last couple months of 2011 were a bit sobering. After those heady days of mediocre growth in mid-2011, Southern Nevada was once again reminded that the post-recession hangover wasn’t over just yet.

In January, the slide in our Recovery Index ended, and the index has sat at 89 for two months now. Flat, but marginally better than December and a clear improvement over Jan/Feb of 2011, 2010 and 2009. Unfortunately, the index is about 10 points lower than it was in Jan/Feb 2008 (when the recession essentially began).

The bright spots in February 2012 was the fact that almost all of the components of the Recovery Index were up year-over-year, with the big boosts being in New Residents (very important for the local economy), Gaming Revenue and Taxable Sales (is retail ready for some growth?) Only one measure was flat – Commercial Occupancy – which is linked to Employment, which was only up 1 point (or 2,200 jobs) year-over-year, and most of those jobs were in Leisure & Hospitality, not in industries related more directly to the occupancy of commercial space.

The good news is that the local economy is, in a slow, measured way, improving. The not-so-good news is that it could still be a while before we really see that improvement in commercial real estate. Jobs is the thing (I might have mentioned that about 3,000 times since 2007), and right now we’re waiting for jobs in the Resort corridor to translate into jobs in the suburbs. The best model I could construct suggests that we should already be seeing that suburban job creation – the lag should be about 6-9 months and hotel/gaming employment began rising about mid-2011. The fact that we’re not suggests that Southern Nevada, like the United States in general, is experiencing a drop in labor force participation related not only to the Great Recession, but to long-term demographic trends and a skill set mismatch between unemployed workers and available jobs.

Demographically speaking, we could be seeing an ebb in the tide of of “two-worker” households. Much of the decline in labor force participation is in the male demographic, so it could be that women are simply displacing men in the job market now, rather than supplementing them. More worrisome is the extension of “childhood” (i.e. living at home and playing video games) into the mid- to late 20’s. A similar phenomenon can be seen in Japan and Europe, and this lack of productivity in the young does present a major problem for nations that seek to redistribute wealth from the young to the old. It might also represent a rational decision by the young, who don’t see much benefit from participating in a society that redistributes money from young folks in the bottom quintile of earners to old folks in the upper quintiles of earners.

Thursday, April 26, 2012

A Few Thoughts on Today's Auction

Last year, Auction.com held an auction that included quite a few commercial pieces located in Las Vegas. The general feeling was that the auction was a success - many properties moved, prices were set, and in the months after property sales increased dramatically in Las Vegas. By the fourth quarter of 2011, though, sales were flagging, and they were downright pathetic in the first quarter of 2012.

For this reason, a few people were hopeful about today's online property auction. They needn't have been.

Today's auction was significantly smaller than last year's auction, and the properties far less stellar. By the time I gave up on watching it, only one property had sold (i.e. auction closed and reserve met). Most of the other 9 finished without the reserve being met, and at final bids a bit higher than one would have expected. The inside dope is that most of those bids came from sellers either trying to juice up interest in their properties (alas - they weren't very convincing shills) or maybe set new "market prices" on their properties. One of the "final eight", Stephanie Paseo Verde, seemed to be a genuine item, and most agreed it was the pick of the litter.

Where does this leave us?

Well, clearly today's auction is not going to spark off a new round of buying in Las Vegas. Oh, sales may improve, but it won't be because of the auction. Another auction is being held in a few weeks, and perhaps that one will fare better. In the meantime, we keep slogging through the Great Recession, waiting for bluer skies.

Tuesday, April 3, 2012

The Employment Coaster ... Buckle Up Vegas

Just thought I would share this graph with you. It shows total employment in all industries (blue bars) in the Las Vegas MSA from 2010 to Feb 2012. According the NDETR, the Las Vegas MSA has lost about 21,000 jobs since Nov 2011. Under most circumstances, this would be worrisome, especially when combined with the weakness experienced in commercial real estate since the third quarter of 2011, but given the weird, bumpy trend we’ve seen over the last couple of years, I’m not so sure. A simple linear trend line (in black) shows that employment is gradually rising, and the series of peaks and troughs might just be an artifact of the process used by NDETR to gather the job numbers. The red line represents net absorption of industrial, office and retail combined. This graph suggests that the trend will be higher net absorption and employment by mid-year. Let’s hope there’s some truth to that.

Click to increase size

Wednesday, March 14, 2012

A Closer Look at January's Vegas Jobs Report

When I compiled the draft numbers for our first quarter reports last week, I was a bit stunned. I had been expecting a weak quarter, but not that weak. Now that I’ve seen the new employment numbers from the Nevada Department of Training, Education and Rehabilitation, I’m not so shocked.

I’ve seen some stories touting the drop in the unemployment rate, but a real delve into the numbers reveals a job market that started the year off by shrinking, with weak numbers across the board, not just in retail where one might expect a drop after the temporary hires for the holiday season.

For Las Vegas, the traditional important numbers have been Leisure & Hospitality - the engine of growth - Construction and Retail. Those are the meat and potatoes.

Leisure & Hospitality (L&H) saw a big boost in employment towards the end of last year which boded well for some more substantial recovery in mid- to late 2012, as those new jobs increased hiring in the wider retail sector, which creates jobs in other sectors, etc. Along come the January 2012 numbers and we see L&H taking a slight breather and giving back a few jobs. Until we see some February numbers float by, we can't call this a trend, but a continuation of the boost would have been more welcome.


Construction is an old story by now, fit for a VH1 Behind the Music episode. A meteoric rise as cheap money drove people into new homes and then an equally meteoric fall in 2008. The last few months, however, have seen the fall become less meteoric, and there were even a couple months in there where month-over-month construction employment increased. And then, once again, we see January numbers and we're back to the bad old days. Again, we can't call this a trend, but it's a painful development when one's optimism was just beginning to return.


The employment sectors that are most important to commercial real estate were universally bad when looking at quarter-over-quarter numbers (okay, except for Wholesale) ...


But not entirely bad when looking at year-over-year numbers, with Retail showing some strength, along with Transportation & Warehousing (linked with retail sales), Wholesale (linked with retail sales) and Manufacturing. The office sector is getting killed, though, and a cessation of growth in the Healthcare sector is a little distressing.


Still, when you look at the employment index (Jan 2006 = 100), you really don't see a recovery you can write home about.


As I’ve said many times, jobs and net absorption are tied pretty close, as this graph illustrates.


All in all, not the best way to start a year that already has some significant headwinds to throw against our sails. Let's see what February's numbers teach us.

Monday, February 27, 2012

Hot & Cold - Mapping Asking Rents in Southern Nevada

My project today was to map asking rents in Southern Nevada using a rent index.

Click for a larger map

The key with rents, of course, is that are highly variable between different product types. While Class A Office product can pull in $3.00 per square foot (psf) on a monthly basis, warehouse pulls in maybe $0.30 psf. To smooth out the differences, I decided to index asking rents for each product type based on the weighted average for that product type in the fourth quarter of 2011. Thus, a warehouse space that was asking the same as the average asking rent for warehouse would be indexed as a "1"; anything asking more would have an index number of higher than 1 and anything lower would have an index number lower than 1. By indexing the availabilities in the database, I can compare different product types on the map above.

The map above ignores anything at or near an average asking price. For the purposes of this map, they are just added noise. Screening them out, we can see some regions of Southern Nevada in terms of how much landlords are asking for rent.

The highest asking rental rates appear to wrap around the west and south portions of the Valley, while lower asking rents predominate in the east, center and north portions. This makes sense. The west and south feature newer construction, while the center and east feature older construction. One might deduce from this map, then, that newer properties command higher rents than older properties, and perhaps they are right. Then again, perhaps they are wrong.

The values on this map are based on "asking" rents, not actual rents. The proof in the pudding is in the taste, and the proof in the asking rents is in the absorption. The question, then, is this: Are those high asking rates scaring prospective tenants away, or are tenants still willing to pay more for the more expensive, newer buildings?

On a submarket basis, combining office, industrial and retail properties, net absorption in 2011 broke down as follows:

Positive Net Absorption (2011 YTD): Airport (197,000 SF), Downtown (325,000 SF), Henderson (234,000 SF), Northwest (31,000 SF), Southwest (342,000 SF)

Negative Net Absorption (2011 YTD): East Las Vegas (-263,000 SF), North Las Vegas (-386,000 SF), West/Central (-294,000 SF)

Lo and behold, we're seeing more positive net absorption in the expensive parts of town than in the inexpensive parts of town. Two exceptions pop out, though. Downtown is seeing big positive net absorption in a fairly reasonably priced part of town, but much of this is due to the completion of the Las Vegas Metropolitan Police Department's new headquarters, which is owned by a private development entity and leased to the LVMPD. The other exception seems to be the Northwest submarket - pretty expensive, but fairly weak net absorption. This, however, may be more of a case of zombie properties, in particular office product owned by General Growth Properties, being unable to compete with other product for tenants.

In the near term, pricing still seems to be a major concern of businesses. There's still plenty of recession to go around, and everybody wants to make it through to the other side. Still, location and age of product clearly play a role in the desirability of space, and though newer properties are more expensive than average, they are still quite affordable compared to rates they were asking two or three years ago. Apparently, tenants are taking the opportunity to move up in the world.

Tuesday, February 21, 2012

The Winter of Our Discontent

For the past three months, the arrow has been pointing down on my Southern Nevada CRE Index, indicating a chilling of the economic climate in Southern Nevada since things ramped up a bit in mid-2011. While most measures still look pretty good when compared to one year ago, the index seems to be predicting at least one, maybe two quarters of lackluster performance for commercial real estate.


Looking at 3-month rolling averages in December on a year-over-year basis, we find the New Home Sales are flat (and disappointing), as is commercial occupancy (effectively flat since Jun 2010). All other measures show improvement year-over-year, with the biggest improvements being in the Gaming Revenue Index (3 point climb), New Residents Index (5 point climb) and Taxable Sales Index (7 point climb).

So, where are the jobs? Although the economy is moving now, it doesn’t appear to be hitting escape velocity. The Employment Index was up by one point, but remains in the same range it has been in since July of 2009. No major drop, but no real climb.


Of course, not all employment sectors are experiencing the same distress. On a year-over-year basis, the Financial Activities sector has taken over the top spot in job losses from Construction, which, by the way, is back to being a “job loser” after showing a little pickup in mid-2011. Wholesale and Manufacturing have also gone over to the dark side, leaving the immediate future of the industrial market looking gloomy. Retail is flat in terms of jobs – and this is a key sector, given how much the economy depends on consumer spending. Retail showed some improvement last year in terms of jobs, but the fourth quarter – the big holiday quarter – was flat, and that leaves 2012 in question. On the office side, the aforementioned trouble in the Financial Activities sector is evened out with job gains in Professional & Business Services and Health Care & Social Assistance. Office might not have too bad a quarter to kick off 2012, but it won’t be anything to write home about.

At the moment (and given how the numbers bounce around, "at the moment" is the best I can do prediction-wise), I predict a poor showing in the first quarter of 2012, with perhaps a slight improvement in the second quarter to give commercial real estate a fairly “meh” first half of 2012. While there has been some crowing over the “improving” job numbers nationally, the fact is that fewer people are working and incomes are not on the rise. Much of the nation’s success has been in the manufacturing sector from, believe it or not, exports. Given the fragile international economy and potential problems in Europe, China and Japan, a manufacturing export economy does not appear to provide a stable foundation for predicting good times ahead. The second half of 2012 may be an improvement over the first half, or it may be its identical twin. If you’re in the market to buy good properties and hold them, you’re probably okay. If you’re a landlord looking for a speedy resolution to your problems, you’re probably out of luck. If you’re a tenant, the market is still yours, and though a few properties have seen their asking rents rise, the majority are still struggling.

Wednesday, February 8, 2012

The Looming Shadow of CMBS

Kevin D. Williamson of the National Review just wrote a piece on the looming CMBS bonanza/Armageddon awaiting us all in 2012. As he points out:

"In New York City alone, there’s about $70 billion worth of commercial mortgages — some of which have been sold off as mortgage-backed securities, naturally — coming due this year. The national total is more than $150 billion, or a bit more than 1 percent of U.S. GDP."

You can read the entire article HERE.

Southern Nevada is, of course, no stranger to the world of distressed commercial real estate. In fact, we're probably in close competition with Sacramento for the honor of being the poster child of distressed commercial real estate. I've been tracking the area's distressed CRE since Q3 of 2009, when we had 4.1 million square feet of distressed space, most of it retail. In Q1 of 2012, we've jumped to 15.4 million square feet of distressed space, most of it now in the industrial sector.


The growth was, of course, astounding early in the recession, but has since calmed down to a trickle.


What we're now waiting to see is ... how will things shake out in 2012. Sales of distressed space had a big boost in the second quarter of 2011, notably after Auction.com's auction of around twenty CRE properties. Auction.com has another auction set for a couple weeks from now, and that might produce the same jolt to the system.

We had better hope that it does. After just one month of Q1, 2012, distressed space has grown by 4.9 percent. If we continue at that rate, we will see the gradual slide in distressed growth make an unwelcome U-turn. If distressed space keeps mounting at the same rate, Y-O-Y growth for the first quarter of 2012 will be in the neighborhood of 16 percent, the worst number we've seen since the first quarter of 2011, and the first increase

How will this potential flood of CMBS affect the local commercial market? It will drive the value of real estate down even further than it already has, which has the perverse side effect of pushing properties that otherwise would be in decent shape underwater in terms of their loan-to-value ratio, thus perpetuating the cycle. As these properties are snapped up by canny investors, they'll be able to undercut their competitors on rent, which to date is proving the key factor in many of the leases being signed these days.

In a nutshell, the cycle of re-valuing commercial real estate is not over by a long shot. You have to forgive property owners for thinking that the 50 percent plus haircut they've taken on the value of their properties has to represent the end of the cycle, but the looming wave of foreclosures and short sales suggests that it is not. Commercial real estate in Southern Nevada is already selling at below replacement cost, and it looks like those values, and prices, are going to be compressed a bit further before all is said and done. The lesson here - there are deals to be had in Southern Nevada, but only if you want to hold them for the long term. While quick flips are not impossible, especially for properties bought at an absolute premium at an auction, they will probably be the exception rather than the rule for the next few years.

Related Posts Plugin for WordPress, Blogger...