Friday, July 27, 2012

It's the Population, Stupid!

Integral to understanding where the local CRE market is heading is understanding what brought it to its current lowly condition. This isn't too tricky really - the obvious answer is the bursting of the housing bubble. Housing went away, took 70,000 + construction jobs with it, and here we sit.

Does that mean the current residential construction is what's holding us back? Well, probably. Gaming has shown some signs of recovery over the past year and half, including expanded employment, but gaming does not appear to be acting as the catalyst for full-scale recovery.

Construction alone, though, is not what Southern Nevada needs. Home sales, like every other "retail" sector have to follow demand, and Southern Nevada currently has enough supply to meet that demand (though this may not be the case in another year or two). What was driving the Southern Nevada economy before the crash is what we are really lacking after the crash ... Population Growth!


You can see from the above table that Nevada's population (most of which is in Clark County) grew steadily since the 1970s - and probably before the 1970s. But around 2009, the unthinkable happens - the population actually drops. Probably not for the first time ever, but for the first time in almost 40 years, Southern Nevada ceases having a steady stream of new residents (net) to buy new homes or rent apartments and go to the stores to buy all the things involved in setting up house, not to mention eating out, shopping for clothes, etc.

Steady population gains, as much as, or quite possibly, more so than gaming, was the engine driving the economy in these parts. Naturally, gaming played its part in providing a source of employment for new-comers, and in-migration itself created the inducement of employment for more folks to put down roots (often very temporary roots) in Las Vegas - though this, of course, proved a double-edged sword.

Where does that leave Southern Nevada now?

As of 2011, the population has leveled, but is still not rising. That's bad news. Possible good news, though, is that in-migration, at least in terms of out-of-state driver's licenses being turned in at the DMV, is showing some signs of recovery from the lows hit in early 2010.


Much of this migration is probably in the form of retirees, since the job market here is still pretty weak (though the Valley is probably suffering from a lack of suitable applicants for many of the available jobs, so some of our new citizens may well have come here to take skilled or professional jobs). Retirees are a welcome sight in Southern Nevada, as they were a key component to growth in the good old days, and will likely be a key component of growth again. Retirees come with their own built-in income, and that income stimulates job growth, especially in the retail and health sectors. Along with the renewed gains in gaming (slow going, though, and remember to watch gaming revenue and taxable sales more than visitor volume), the renewal of migration to Southern Nevada may prove to be what the region needs to begin a serious recovery, especially in terms of commercial real estate.

Tuesday, July 24, 2012

Still Arguing About Taxes ...

Via Wikimedia Commons

Some things never change, huh? I'm wondering what the other paths represent?

Of course, Congress will probably end up compromising and using them both ...

Monday, July 23, 2012

US Population Expansion, 1770 to 1900

I found this neat little video today on Wikimedia Commons of the expansion of settlements in the United States between 1770 and 1900, apparently based on the locations of post offices, and thought I'd share it with folks.


It is the work of Derek Watkins, and was originally posted at his blog HERE.

Wednesday, July 11, 2012

Top 100 Retailers for 2012

NRF Stores has compiled a list of the Top 100 retailers in 2012. You can see the full list here, but here's a quick recap of the top 10:

1. Wal-Mart
2. Kroger
3. Target
4. Walgreen
5. Costco
6. Home Depot
7. CVS Caremark
8. Lowe's
9. Best Buy
10. Safeway

Of note, I think, is Amazon's position of #15. One might interpret that in two ways, the first being that they didn't really exist a decade ago, and are now beating out some old heavyweights like J.C. Penny's and Burger King. On the other hand, it is interesting that the world's biggest online retailer is only #15, though to be fair just about every retailer these days is an online retailer to some degree. Still, brick and mortar retail certainly isn't dead yet.

Southern Nevada's latest retail numbers, for the second quarter of 2012, are now available to download and enjoy (if you're into that sort of thing). Here's an excerpt:

 We can happily report that our predictions for the second quarter of 2012 concerning the retail market were wrong, as retail turned in a surprisingly strong quarter. Even without new construction to bolster it, net absorption of retail space was not only positive, but surpassed net absorption in the first quarter of 2012 if one discounts net absorption from new completions. Vacancy declined to 11.1 percent in the second quarter of 2012, 0.6 points lower than one year ago. Asking rents for retail space increased this quarter to $1.40 per square foot (psf) per month on a triple net (NNN) basis, though they remain lower than they were one year ago.

Friday, June 22, 2012

CRE Recovery Index Side Steps in April

Click to Enlarge

The April figures are all in, and the CRE Recovery Index took a step back.

The last two years have seen the index follow a pattern - growth in the spring and summer, decline in the fall and winter, but overall more growth than decline. When the index began to slip last year and then showed some growth in the first quarter of 2012, it looked like the pattern was going to hold, and it still might. April saw the index move back a point, but May data looks like that step back is due to be reversed, assuming new home sales and taxable sales cooperate.

An index in flux would suggest a bumpy second half to 2012, while one that returns to growth could mean 2012 might be salvaged after all for commercial real estate in Southern Nevada.

Looking at that graph, though, it isn't hard to imagine that it will take at least 2 more years before Southern Nevada's CRE market is once again firing on all cylinders. What's holding us back?

Click to Enlarge

I'm not positive, but it could be the construction employment, or the lack thereof. While most employment sectors are better off than they were 10 years ago, despite the Great Recession, construction employment is well below where it was 10 years ago, and those construction jobs were important job creators in the Valley.

The larger problem for Southern Nevada, though, is illustrated by this graph:

Click to Enlarge

How many recessions did we go through from 1970 until today, and during none of them did Nevada's population stop growing, even for a year until the onset of the Great Recession. Whether the Great Depression had the same effect, I don't know, but it seems likely.

As it stands now, we still haven't worked our way back up to the population level we had in 2007 - and that indicates a real estate market, both commercial and residential, that can make lateral moves, but will find renewed growth a tricky thing to achieve.


Keep your eyes on the in-migration into Clark County, because that could be the ultimate key to recovery in Southern Nevada. It looks like the flow of people is beginning to return, though it isn't close to the peak of migration in 2005-2006. My guess is that most of the new residents to the Valley are retirees, as the job market in Southern Nevada, though showing signs of recovery, continues to be weak.  As these folks move in with their preexisting incomes, they should help stimulate job growth in the Valley and thus absorption in the residential and commercial markets.

One last graph - commercial forward supply (i.e. planned and under construction space) - just because I like it.

Click to Enlarge

Enjoy your weekend, and if you can spare a dime, go spend one.

Friday, June 8, 2012

Obsolesence ... My New Favorite Word

Hey, the reporters seem to like it, and I like attention. What can I say?

Actually, obsolescence in commercial real estate could be Las Vegas' friend. I stress "could be". Southern Nevada took a major hit in the past decade in the form of construction employment.

Ouch!

Yes, letting the construction line actually drop off the graph was a bit dramatic of me, but without doing it the other lines flatten out quite a bit. What we see here is the Southern Nevada job market split into three categories - Construction, Leisure & Hospitality (L/H) and "All Other Sectors (AOS). Since the beginning of the current recession, job losses in L/H have leveled and are now recovering. Normally, we would expect to see jobs in AOS begin to do same after a couple quarters ... but we're not. Why? Perhaps it is because construction jobs have not just fallen off, they have fallen well below where they were before the boom, and they aren't done falling yet (though they did level off quite a bit). Construction jobs pay pretty well, and might have had a bigger impact on AOS than L/H.

This is why obsolescence could be a good thing.

As we currently stand, given the vast amount of vacant space on the market, and given the slow employment growth and thus slow growth in demand for that vacant real estate, getting the market back to a place where it would normally be rational to build could take a very long time.

That's a lot of years of supply!

Obsolescence, however, offers the proposition that some product in the Valley will simply remain vacant for a long time without negatively impacting the market going foward.

What are the signs of obsolescence? Well, the age of a building doesn't seem to be a major factor, at least not yet.

Almost as pretty as a double rainbow!

The graph above looks at the average time on the market (in months) of availabilities based on the age of the building in which those availabilities are located. The dotted lines are trend lines. While office suggests that newer is better, industrial and retail refute that, and in all three sectors buildings constructed in the past 5 years (about 20 million square feet worth, which also have the highest vacancy rates among buildings based on age categories) are among the least popular.

Some of this can be attributed to properties built during "irrational exuberance" of the boom - buildings meant to please lenders more than tenants.

The obsolescence that Southern Nevada is now facing is largely a matter of a disconnect between what prospective tenants want, and what we have available on the market. Just as there is a disconnect between available jobs and the skills of available jobless, the product that could be moving rather well right now is space we do not have. As a result, Southern Nevada is losing some business to other markets, and those companies that want to be here badly enough are going the route of build-to-suit. Land costs are quite low, as are construction costs, and the idea of designing a building seems to have caught on with a few industrial users, though BTS will probably not be as prominent in office and retail.

BTS projects are not, of course, going to turn the construction sector around - that's going to take a resurgence of the residential market. On the other hand, the construction sector can use all the help it can get.


Monday, June 4, 2012

May Activity Improved Over April

Database activity in May points to a somewhat brighter picture for Q2 of 2012, after a pretty dismal Q1.

The task of compiling vacancy numbers is a bit on the arduous side, so I only do it once per quarter. Tracking database activity, on the other hand, is a bit easier, so I do it monthly to get an idea of how the quarterly numbers might pan out.

Admittedly, totals like these can be deceptive. If I take one 100,000 square foot availability out of my database and then add in three 5,000 square foot availabilities, the market is better off, even though my database activity is going to show a net of 2 added availabilities, but since I'm dealing with hundreds of records flipping each quarter, the data seems to pan out pretty well in terms of predicting performance.

Click on the graph to make larger

The graph above tracks the percentage of availabilities removed (either as sales, sub-leases, leases or, in some cases, an availability simply being withdrawn from market) to the total number of availability updates that quarter. On average, I update over 9,000 availability records every quarter (which means that some availabilities are updated multiple times each quarter), so if the percentage of availability removals rises, it often correlates to stronger performance in the market.

You'll notice above that there was a spike of availability removals in the second quarter of 2011, which did in fact correspond to better net absorption numbers. The percentage of removals then dipped in the third and fourth quarters, and has risen significantly in the second quarter of 2012. This suggests that net absorption will be improved in Q2, 2012 (knock on wood). More importantly, the trend does suggest a slowly improving market. It also shows, over the past three years, a pattern of increased (positive) activity in the second quarter of each year, followed by a lull in the second half of the year.

Click on graph to enlarge

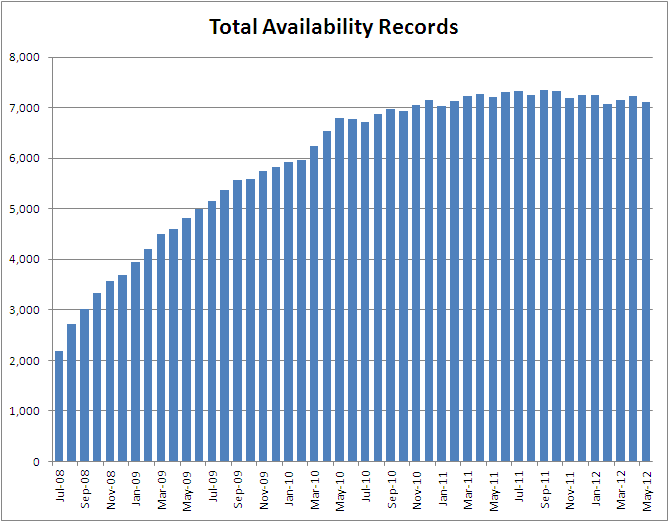
The total number of availabilities tracked in the system declined in May after having risen in March and April. In the graph above, you can see the rapid rise in total availabilities from July 2008 to September 2010, then the slower rise from September 2010 to May 2011, and the very gradual downward slope (so gradual it almost looks flat) beginning in May 2011 and running to the present figures.

Click on graph to make larger

Breaking the "new availabilities added" down by product type, you can see - well, actually, you can see quite a mess. Month to month, availability additions can vary quite a bit, but the general trend has been downward, with office and industrial showing the steepest slope. Again, this is the total number of availabilities added, not the total amount of available square footage added.

You'll also note that the number of availabilities added increased for every property type in May 2012; fortunately, the number of availabilities removed was even stronger.

The overall trend seems to be favoring Southern Nevada - with fewer new availabilities over time, and fairly steady, though not rising, removals of availabilities over time. This actually sums up the market pretty well, with recovery being more a situation of "less bad" than "more good". As the wreckage of the Great Recession is gradually cleared, slow (perhaps very slow) and steady will win the race, even if it isn't very sexy.
Related Posts Plugin for WordPress, Blogger...